Parameters
| Name | Explanation |
|---|---|
| x | An array of x coordinate values defining points of a polygonal area on the image. (in pixels) * |
| y | An array of y coordinate values defining points of a polygonal area on the image. (in pixels) * |
| Points | The number of points defining the polygonal area on the image. |
| spx | An array of RGB values defining the x coordinates of points on the RGBSpline curve. (from 0 to 255) ** |
| spy | An array of RGB values defining the y coordinates of points on the RGBSpline curve. (from 0 to 255) ** |
| spPoints | The number of (spx, spy) coordinates in the array (from 3 to 10) |
| Red | Affects the red component of the RGB value (False(0): does not affect the red component, True( nonzero): affects the red component) |
| Green | Affects the green component of the RGB value (False(0): does not affect the green component, True( nonzero): affects the green component) |
| Blue | Affects the blue component of the RGB value (False(0): does not affect the blue component, True( nonzero): affects the blue component) |
| * In Visual C++, pass the pointer to the first
element in the x and y arrays. In Visual Basic, the arguments are returned in the first elements of the arrays x(0) and y(0). ** Use the Spx and Spy arrays in the same way as the x and y arrays explained above. |
|
Return Value
Returns True (nonzero) if successful, otherwise returns False (0).
Explanation
The RGBSpline method uses a spline function to modify the
RGB values of a raster image. A spline function is a method of
interpolating values that lay in between data points. In other
words it produces a smooth curve from a limited set of points.
The RGBSpline method allows you to define the relationship
between the input RGB values in the original image and output RGB
values in the newly created image. You do this by specifying a set
of coordinate points where the input RGB values are the x
coordinates and the output RGB values are the y coordinates. These
coordinate points are stored in arrays and passed to the
RGBSpline method through the spx and spy parameters. The
RGBSpline method then interpolates a "smooth" curve from
these coordinate points. The graphic representation of this
relationship between input RGB and output RGB values is known as
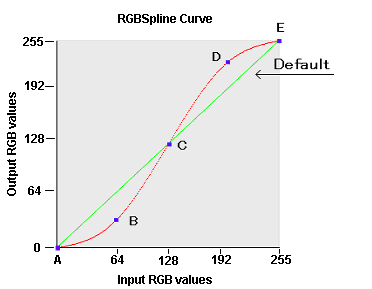
the RGBSpline curve. A sample RGBSpline curve is shown in the
diagram below:

In the above diagram, the green default RGBSpline curve represents
no change between input RGB values and output RGB values. In this
case, the newly created image is exactly the same as the orginal
image. The red RGBSpline curve represents an increase in contrast
between the original image and the newly created image. It was
generated from the following points:
Point (spx
values,spy values)
-----------------------------------------------------
Point
A (0,0)
Point
B (64,32)
Point
C (128,128)
Point
D (192,160)
Point
E (255,255)
At the midpoint of the red RGBSpline curve, the input RGB value of
128 equals the output RGB value of 128. At points below the
midpoint, however, the output RGB values are lower than the input
RGB values. This means that dark colors become darker. Conversely,
at points above the midpoint, output RGB values are higher than
input RGB values. This means that light colors become lighter. This
particular RGBSpline curve therefore increases the contrast of the
image.
An RGBSpline curve that decreases contrast could be defined with
the following points:
Point (spx
values,spy values)
----------------------------------------------------
Point
A (0,0)
Point
B (64, 96)
Point
C (128,128)
Point
D (225, 192)
Point
E (255,255)
To execute the RGBSpline method, set the image handle of the
image in the ImageHandle
property or the Layer(LayerNo).ImageHandle
property. The RGBSpline method supports 1, 4, 8, 16, 24, and
32 bit images.
Before executing the RGBSpline method, you must set the area
on the image that will be affected. There are 4 ways to do
this.
- To use a mask image, set the SelectMode property to 0. Set the mask image handle in the MaskImageHandle property
- To process the total image, set the SelectMode property to 1
- To process the polygonal area on the image, set the SelectMode property to 2. Select the polygon by setting the appropriate coordinate values for the points of the polygon in two arrays, one array for the x coordinate values and one array for the y coordinate values. The pass these arrays to the x and y arguments of the RGBSpline method. The number of points defining the polygon must be 3 or more
- To process an elliptical area on the image, set the SelectMode property to 3. Select the ellipse by setting the appropriate values for the bounding rectangle in the RectLeft, RectTop, RectRight, and RectBottom properties
When the SelectMode
property is set to values other than 2 (ikEffectPolygon), please
set dummy arrays in the x and y parameters and set the Points
parameter to 0.
When the SelectMode property
is set to 2 or 3, the appropriate value must be set in the InOut property. When a 1, 4, or 8 bit image
is processed, the total image will be processed regardless of the
value set in the SelectMode
property.
If successful the resulting raster image data is set in the
LayerNo property (the ImageHandle property or the
Layer(LayerNo).ImageHandle
property. If unsuccessful, 0 is returned.
When the Caption, Message, and ButtonName properties are blank, the
progress dialog box will not be displayed. When the progress dialog
box is displayed, the percentage that the processing has completed
will be shown in the dialog box.
For scripting languages and other programs that require variant
types, please refer to the RGBSplineVariant method.